All posts by admin

What is Q of Ops?

In a “Quality of Earnings” (Q of E) report the accounting firm audits the financial statements to vet EBITDA, to determine what it is.  Their report will also likely assess the risk of maintaining recent performance at a relatively high level (customer concentration, product mix/margins, etc.).   The Q of E has always been a standard component of the diligence process.  But in today’s deal environment, for a PE firm to understand the full potential of a target – and therefore be competitive in the bid process – they need to go deeper.

A buy side Q of Ops diligence (similar to a Q of E but with a focus on Operations instead) looks at how management runs the company today and determines what EBITDA “should be”.  It answers three basic questions.

  1. What is the likelihood that the company can replicate current performance in the future?  What risks exist that endanger the stability of company EBITDA and free cash flow.
  2. What fundamental changes are needed to scale the company?
  3. What is the financial impact of realizing the latent or hidden value within the company?  The impact on EBITDA, working capital, capacity, lead times, retention, employee engagement, sustainability and/or safety.

Why do a Q of Ops?

Our clients that perform a Q of Ops report the following reasons:

  1. They are tired of losing on a deal and then seeing the winning PE firm succeed in growing the value of the company.
  2. They are frustrated when they end up having to “write a check after writing the check”.  They want to know what they will have to do to maintain EBITDA and grow the company before they close.
  3. They are concerned about hitting the ground running post close.  They want management focused on getting ahead of plan early in the hold and on building momentum for sustainable value growth while they are onboarding the portfolio company.

Sell Side Q of Ops

One major accounting firm we work with reported that they did 0 sell side Q of E’s in 2013, 2 in 2014, 54 in 2015 and over 130 in 2017.  It is a real trend and is proving to be a good investment.  This preparation leads to a smoother close and gives the seller a chance to prepare answers to likely questions and objections.

A sell side Q of Ops is most relevant when the PE firm is:

  1. Worried that selling a portfolio company with mediocre performance will drag down fund performance.
  2. Concerned that the portfolio company is, as one client put it, “a $5 million EBITDA company doing $3 million”. 
  3. Exhausted from investing so much personal time into a portfolio company.

The sellside Q of Ops quantifies the latent value hidden beneath current management practices.  It provides the PE firm and the management team a clear data-driven path to realize that value BEFORE entering the exit phase.

First Steps?

If you relate to the any of the symptoms described above, reach out to Tim Van Mieghem to explore whether the Q of Ops would be a good investment.

Timothy Van Mieghem
tvm@proactiongroup.com
The ProAction Group, LLC
150 North Wacker Drive
Suite 2500
Chicago, IL 60606
Tel: (312) 371-8323
www.proactiongroup.com

The Competition is Fierce. Change the Rules. ™

Sell Side Q of Ops

Our client was looking to seek new investors in a manufacturer of consumer products located in the Southeast Region of the US, and requested that we tour the operation.

Fortunately for everyone involved, we saw immediate opportunities for improvement. The company’s production runs were designed to manufacture 8-12 week supplies of any given SKU. Naturally, this was creating a feast or famine situation. Overproduced SKUs tied up capital, while fulfillment of items still in the queue was delayed and expensive. We believed that implementing Lean Manufacturing principles would result in a 40% increase in production per labor hour. This would dramatically impact the organization’s capacity, throughput and EBITDA.

Background:

  • Identified changes to manufacturing processes could drive a meaningful increase in the company’s market value in less than a quarter.
  • These changes required 8 weeks to implement and a immediately demonstrated a 44% increase in production per labor hour

ProAction illuminated the path forward for our client:

  • Re-designed Processes: The company’s throughput could be greatly increased by employing a one-piece flow manufacturing process instead of batching. This new Lean Manufacturing model is efficient enough to create labor and staffing reductions, and can drive a cycle of continuous improvement. It also substantially decreases lead times.
  • Improved Capacity: During our review we found that one particular product was accounting for 24% of the company’s sales. As we planned for the future state, it was clear to us that implementation of the one-piece flow system would allow the company to realize a 30% capacity improvement for this product with one less line and three fewer people.
  • Facility Layout Improvements: Layout changes dovetailed with the company’s new Lean Manufacturing to accomplish two goals. It made production processes more transparent, making oversight easier and ensuring abnormalities would be spotted quickly. It also reduced wasted travel and motion. The changes enable production rates to be set by product type, leading to more accurate scheduling and increased accountability.
  • Labor Balancing: When considering staffing reductions, we found that continuing the fourth packing line and filling it out with three employees who had become redundant elsewhere would increase capacity improvement from 30% to 38%. Co-locating the company’s two warehouses reduced staffing and expenses.

Actions Taken:

  • Redesigned the factory layout and executed on that design
  • Implemented Lean Manufacturing
  • Streamlined processes to decrease materials handling and improve efficiency
  • Reallocated staffing to realize additional capacity gains and reduced labor spend

Impact:

  • 10% reduction in labor
  • 38% increase in capacity
  • 44% increase in productivity
  • Shorter manufacturing lead times
  • More visible, easier to manage “one piece flow” process
  • Additional savings in receiving, inventory control and shipping

Measurable Results:

  • 44% productivity increase
  • 25x return on dollars spent
  • Full transition in less than 8 weeks

About The ProAction Group

ProAction is an operational consulting firm that works with Private Equity to do three things:

1. Help you win good deals (and avoid bad ones!) through our pre-close “Q of Ops”.

2. Help your management teams as they transition from an entrepreneurial approach to a scalable, process driven leadership path.

3. Help you maximize the value of your portfolio companies through the implementation of operational excellence.

We focus on three sectors: consumer products, manufacturing and distribution. We have experts in Lean Manufacturing, Six Sigma, Sales and Operations Planning, Inventory Strategy, Sourcing, Logistics and Human Capital Development. We were founded in 1995 and are headquartered in Chicago.

For Further Information:
Timothy Van Mieghem
tvm@proactiongroup.com
The ProAction Group, LLC
150 North Wacker Drive
Suite 2500
Chicago, IL 60606
Tel: (312) 371-8323
www.proactiongroup.com

The Competition is Fierce. Change the Rules. ™

Identifying Operational Opportunities to Improve Pricing During Due Diligence

This is the sixth article in our series on Identifying Opportunities to Improve Operations. We have divided the opportunities to increase the market capitalization of a company into seven value lever buckets. For each area we describe the signs we look for that indicate the company can improve their financial performance. In other words, we are highlighting points you want to know BEFORE you buy the company; things that expose opportunities to increase EBITDA, capacity and asset utilization.

The Seven Value Levers include:

  1. Throughput. Can we increase the output of a plant, office, service location, or other facility?
  2. Variable Costs. Can we reduce the costs directly tied to our volume and revenues?
  3. Fixed Costs. Can we reduce the costs that do not change in the short term, based on customer demand?
  4. Order to Cash Cycle. Can we shrink the time between investment on our part and collection from our customers?
  5. Pricing. Can we collect more revenue for the services we are providing?
  6. Asset Utilization. Can we increase inventory turns, the use of plant equipment, or the use of facilities?
  7. Risk. How can we reduce risks related to running our business?

In this article we share with you the signs we look for that indicate a company may be able to effectively increase their revenues and EBITDA through pricing. From a results perspective, we are looking for indications that our client can:

  • Increase overall pricing levels, often from 1-3% of total revenues
  • Reduce or eliminate “leakage” from designed pricing strategies or plans
  • Identify price elastic and inelastic items
  • Address any issues related to the gap between gross and net sales
  • Collect more revenue in the current market

This is a powerful topic; finding opportunities to get paid more for what you do. Effective pricing strategies and practices lead to designed increases in margins where customers are willing to pay more. The following indicators demonstrate that a company is not consistent in the pricing approach, is leaving money on the table, or is allowing the company to execute policies that are out of alignment with company strategy and direction.

IndicatorWhat it can mean
Does the company
monitor margins by
product and customer
segment?
If the management team doesn’t have reports showing trends and variation
in actual transactional prices, then there is opportunity; if they can’t measure
it, they can’t manage it.
The best practice here would be to not only track trends and variation in
margins, but to do so by customer and part / SKU (“stock keeping unit”)
segment.
When a price increase
is decided, is the
actual yield
monitored?
One effective approach we use in performing due diligence is to interview
managers and workers on how they address various functions and duties.
Then, we also look at history, at actual numbers. This allows us to
triangulate people’s perception of how pricing is managed with real history.
Fortunately, if a company keeps their sales history, we can retroactively
track pricing change yield. If, however, management doesn’t have access
to this data and does not monitor performance, then the company is
vulnerable to pricing “leakage”.
Can a sales rep or
inside sales person
change the price for
an item based on their
judgment?
Sales people only lose a portion of their commission if they reduce the price
of an item. They stand to lose the entire commission, however, if they miss
the sale. This can provide an unbalanced motivation. Proper controls limit
the ability for any sales person or manager to provide a discount or price
reduction outside of designed parameters. If these controls are not formal
and discrete, there is likely a meaningful opportunity to investigate.
Decisions on prices
and near-price
discounts, deductions
and incentives are
made independently
of each other – rather
than in an integrated
fashion
When decisions are made based on the total cost of ownership, we often
find that well balanced choices are made. There is no opportunity to
squeeze one end of the balloon and simply move the problem to another
department or budget. When determining how we will treat various
customer segments and sku’s, if we do not address all components (pricing,
discounts, freight, accessorial charges, etc.), then there is a meaningful
potential that one group of customers or products are subsidizing others.
People paid as a
percentage of
revenue or gross
margin dollars (e.g.
salespeople and sales
managers) make
some or all pricing
decisions
Whether we are talking about selling standard products off a price list or
complex designed services off a quote, if the people that get paid on making
the sale have a say in the price charged, there is a danger that we are
allowing personal goals and motivations to supersede company strategy
and goals.
Can a price in the
system be changed
by someone not
specifically
authorized to make a
pricing decision?
When we conduct our diligence work in the field, we start with the historic
data. We look for any variance in prices charged; we look for actual
compliance with company policies. When we do find a gap or a meaningful
variance, we then look to see who can change a price or discount in the
system. Often, executives and managers are surprised to find that many
people within the system have the ability (even if they are prohibited from
doing so) to change or set pricing levels.
Margins on lower
volume sku’s and
higher volatility sku’s
aren’t differentiated
from high volume or
stable products
Low volumes and high volatility drive higher costs. Providing the desired
quantity of low volume and volatile parts to customers when and where they
want them adds value. Largely speaking, these items should have a higher
margin than products that drive high levels of steady demand. If the
company does not segment their products by volume and volatility and
monitor margins, there is an opportunity.
Margins by sku and
customer segment
are not tracked and
monitored by the
executive team
Similarly, providing goods and services to smaller customers when and
where they want them creates value. Smaller customers do not have the
scale to evaluate other options as larger ones do. A company should have
a designed policy or pricing approach that differentiates how we price
different customer segments. If margins are not tracked by customer and
product segment, then we need to investigate.
Is there a structured
set of rules, controls
and baselines in place
to address one-off or
job shop type
quoting?
For custom and designed products and services, companies need to
provide specific quotes during the sales process. If the same item would be
quoted differently based on who in the company completes the quote, there
is an opportunity to improve pricing. Even more so, if the same person
might quote an item differently on two different days, there is an opportunity.
There should be pricing tables, consistent component costing, rates, rules
and worksheet tools to support a consistent and designed quoting process.
Are margins on
projects or jobs
tracked and
compared to the
quote?
For custom projects and services, we need to provide a quote during the
sales process. High performing companies can show how completed
projects and services compare to the original quote. Further, the company
should be able to show what actions they take to improve the quoting
process based on actual performance. If any of these pieces are missing,
there is an opportunity to improve.
Cost plus pricing If we find evidence that “cost plus” pricing plays a meaningful role in setting
pricing levels, then we see opportunity.
Elastic and inelastic
pricing is not
evaluated
Retailers have found success in setting low prices on items that drive
consumer behavior. If the grocery store sets a low price for milk, then
customers flock to the store and they never check the price of snack items,
for example. The same relationship holds true for companies selling to
other companies (B2B). If a company does not analyze and track elasticity
by part, then there is opportunity.

Recently, we worked for a company that had hundreds of sales people in a dozen regions. The company retained us to find out what was causing a double digit gap between gross and net sales. While there was a companywide, executive driven mandate to hold firm on pricing, we found that sales people were routinely providing discounts. The sales people had good intentions and wanted to close the sale, but the executive team had developed their pricing strategy on sound principles and needed their mandate to be carried out. The company’s regional controllers were aware of the mandate, but lacked conviction that it was truly in the best interest of the company. After uncovering the issue, we were able to design simple reports that tracked compliance and allowed management to monitor pricing levels. Within a short time management’s strategy was carried out throughout the company and net margins increased by over 3 points. Because this company had a 10% EBITDA margin to start with, this increase generated a 21% increase in EBITDA.

Another client, a consumer packaging company, recognized that low volume and highly volatile sku’s did not carry any premium pricing over high volume and stable items. Correcting this added $500,000 in margin, an increase of 8% in overall EBITDA.

There are many examples like these. Look for these indicators. When you find them, it is time to investigate and take action!

If you have any questions or requests, please feel free to contact me at tvm@proactiongroup.com.

Case Study: Sell Side Q of Ops


Big EBITDA Gains Identified in Overstocked, Underperforming Portfolio Company

Eight years after purchasing a consumer product company, our private equity client found themselves in the frustrating position of spending too much time and attention on one underperforming portfolio company.

The issues were clear: inventory kept increasing, and management was at a loss to explain why. Matters were further complicated by some of the inventory’s limited shelf life. Though demand was very seasonal, at the end of their last busy season the company had the highest inventory levels in its history. These issues resulted in an EBITDA to sales ratio of less than 6.5%: earning less than $6.4 million in EBITDA on about $100 million in sales.

Exiting the underperforming company wasn’t feasible, as it would result in mediocre performance for the client’s fund.

Background:

  • Underperforming portfolio company had excess inventory; products with limited shelf life compounded losses.
  • EBITDA performance lagged the industry and fell short of projections.
  • Exiting would drag down overall fund performance.

ProAction performed a Sell Side “QofOps” to identify and quantify their opportunities to create and claim value before their exit. Here are the highlights:

  • Recast Inventory: The company had $28 million in inventory, and we modeled how much they really needed given their supplier lead times, manufacturing capacity and customer locations. They only needed $12 million to run the company assuming solid processes and systems.
  • Segmented the Business: One size does NOT fit all! We segmented the business into 9 segments. We learned where they made money and where they gave it back. This allowed us to develop surgical recommendations to project their position with important customers and their ability to serve other customers in a profitable manner.
  • Targeted Savings: We examined their SG&A spend, their approach to sourcing purchased goods and services, and their DC’s and factories. This allowed us to quantify how much more EBITDA they can generate at the current sales levels.
  • Re-designed Planning Processes: We reviewed the company’s supply and demand planning processes, and isolated opportunities to leverage supplier resources, reduce inventory, and increase order fulfillment levels.
  • Fostered Adoption: By including key members of the management team in the design process, we were able to do more than deliver a report. We generated a detailed implementation plan and laid the foundation for change.

Actions Taken:

  • Optimized processes around the 8% of customers and 22% of SKUs that make up 88%+ of gross margin produced.
  • Built the business case to consolidate 4 facilities into 3.
  • Designed a Lean enterprise and a planning culture, with tracking and monitoring methodology built into all processes.

Quantified Impact of Recommendations:

As part of building a business case for the recommendation, we estimated the net benefits of taking action.  Namely, as a result of the identified changes, the client would realize the following net benefits:

  • Increase EBITDA between 69% and 108%.
  • Pay down up to $16 million in debt.
  • Increase order fulfillment, customer satisfaction levels, flexibility and inventory turns.
  • Reduce customer lead times.
  • Fully leverage recent ERP.

About The ProAction Group

ProAction is an operational consulting firm that works with Private Equity to do three things:

  1. Help you win good deals (and avoid bad ones!) through our pre-close Operational Due Diligence and “Q of Ops” Diagnostic Reports.
  2. Facilitate your management team’s transition from an entrepreneurial to a scalable, process driven leadership path.  We act as their training wheels.
  3. Conduct our Operational Diligence on “stale” portfolio companies.  We quantify any latent value that can be freed up through operational changes.

We focus on three sectors: consumer products, manufacturing and distribution. We have experts in Lean Manufacturing, Six Sigma, Sales and Operations Planning, Inventory Strategy, Sourcing, Logistics and Human Capital Development. We were founded in 1995 and are headquartered in Chicago.

For Further Information:
Timothy Van Mieghem
tvm@proactiongroup.com
The ProAction Group, LLC
445 North Wells St. Suite 404
Chicago, IL 60654
Tel: (312) 371-8323
www.proactiongroup.com

The Competition is Fierce. Change the Rules. ™

Employee Engagement in a Pre-Close Q of Ops

Have you ever been to a party that was full of conversation, stories, and real fellowship?  Maybe cigars by the grill, good friends watching a game or even a book club where you really get to share your ideas and opinions.  A place where you feel safe, part of the group and where you can just be yourself.  Time flies, you feel rejuvenated and you develop real bonds.  Have you ever been in such a group and then a new person comes in and everything changes?  You have to watch what you say, there is drama at every get-together and the spirit goes out.

When this happens at work it can distract the company and drain the energy that should go into serving customers, each other and the collective mission.  The concept that measures the level of employee commitment to an organization is Employee Engagement.  According to Frank Heegaard, an employee engagement expert, there are 3 basic buckets for employee engagement:

  • Bucket 1:  Actively engaged employees.  This describes the people that bounce into work in the morning with a clear mission, the tools to complete that mission and they drive successful customer and coworker interactions.  Up to 1/3rd of workers normally fall into this category in relatively healthy companies.
  • Bucket 2: Dis-engaged employees.  These are the people that show up, they do what they are told and not much more.  As many as half the employees fall into this category.  It is not that these are bad people, but they often just don’t see how they can make a difference, and they don’t feel empowered or motivated.  Many do not respond well to how they are managed.
  • Bucket 3: Actively Dis-engaged Employees.  Depending on the year and the region this group ranges from 15% to 30% of the workforce.  These people are angry, resentful or hurt.  They feel impotent.  They feel stifled and they often blame management.  And they undo much of the good done by the engaged employees. 

Why Focus on Employee Engagement?

The concept has been around for a long time, but recently it is gaining more traction as progressive companies have demonstrated substantial improvements in all metrics.  The real question is, how is this concept relevant and actionable when working to acquire a company?  Here are some points to consider:

  1. Employee engagement is measurable.  It is measurable, pre-close, even if the company does not currently measure it. 
  2. The company’s current performance is an outcome of, among other things, the current actual level of employee engagement.
  3. Steps can be taken to improve employee engagement (post close). 
  4. Addressing employee engagement requires real work and change.   The benefits start to take shape immediately, quickly develop momentum (within months), and build on prior levels. 

I had the good fortune to visit Tasty Catering, a privately held catering company in Elk Grove Village, IL.  Tom Walter, the co-founder and “Chief Culture Officer” and his partners have nurtured an atmosphere in which 94% of employees are actively engaged in the business.  Their EBITDA % is DOUBLE their industry average. 

Studies consistently show similar patterns.  A UK study (http://engageforsuccess.org/wp-content/uploads/2015/09/The-Evidence.pdf), shows that the companies in the top quartile in employee engagement in their industry have double the EBITDA vs. their lower performing counterparts.  As you might expect, employee engagement affects more than just EBITDA.  Lead times, customer satisfaction, turnover, quality and safety follow the same pattern.

Below are some of the top reasons Private Equity firms have said led them to invest in measuring and improving their Employee Engagement.  If any of these ring true to you, this might be an actionable area for your firm to  pursue as well.

  1. They were concerned because a portfolio company was experiencing high levels of voluntary turnover in management and skilled positions.
  2. They were frustrated over consistently high injury rates and poor safety.  One barometer we use for evaluating operational excellence in a company is their performance around Environmental, Health and Safety (EH&S).  If the company doesn’t pay close attention and lead their team to excellence in this core area, they are also leaving other opportunities untapped.
  3. They were nervous because they just didn’t know how they were doing.  Today, we measure net promoter scores and other metrics to understand how customers see us.  We can do the same thing with our employees.

Additionally, if you are looking at a deal/company where either employee engagement is critical or there are signs of employee disengagement, we can add this to our diligence work.  We have teamed with a group that can quickly assess current levels of engagement and guide you through the process of creating an engaged team that will set you apart from your competitors, increase EBITDA and grow the value of your portfolio.

Identifying Operational Opportunities to Increase Asset Utilization During Due Diligence

A few years ago we conducted a diagnostic review for a large commodity manufacturing and distribution client. They had a fleet of hundreds of rail cars and contracts with many rail roads. Most of our time was spent reviewing and benchmarking the rail contracts and rates. As we asked questions about their processes, metrics and reports, we found that they tracked the utilization rate of their rail car fleet. The report showed a 100% utilization rate. Naturally, this seemed too good to be true. So we talked to the manager and asked how the utilization rate was calculated. We were anticipating that they tracked loaded ton miles vs. a standard, or something similar. Instead, we found that they tracked whether each rail car was used in a month. They had 213 rail cars, and they had 213 loads in the month, so their utilization was 100%. This discovery led to a process
review and, eventually, process improvements that allowed the company to reduce their fleet by 70%. This reduction did not diminish customer service levels. The excess rail cars were the result of a loose process and a lack of thoughtful oversight. The new improved process allowed the company to stop incurring non-value adding expenses.

This is one of many articles in our series on Identifying Opportunities to Improve Operations, and it focuses on identifying opportunities to improve asset utilization. We have divided the opportunities to increase the market capitalization of a company into seven value lever buckets. For each area we describe the signs we look for that indicate the company can improve their financial performance, position in the market and their enterprise value. In other words, we are highlighting points you want to know BEFORE you buy the company; things that expose opportunities to increase EBITDA, capacity and asset utilization.

The Seven Value Levers include:

  1. Throughput. Can we increase the output of a plant, office, service location, or other facility?
  2. Variable Costs. Can we reduce the costs directly tied to our volume and revenues?
  3. Fixed Costs. Can we reduce the costs that do not change in the short term, based on customer demand?
  4. Order to Cash Cycle. Can we shrink the time between investment on our part and collection from our customers?
  5. Pricing. Can we collect more revenue for the services we are providing?
  6. Risk. How can we reduce risks related to running our business
  7. Asset Utilization. Can we increase inventory turns, the use of plant equipment, or the use of facilities?

A company leverages its assets to create and fulfill customer demand. In this section, we are looking for indications that the company can increase EBITDA, decrease working capital and increase return on capital through:

  • Consolidating facilities
  • Increasing turns on inventory
  • Realizing more revenue and throughput from existing assets and equipment
  • Reducing days of sales outstanding in Accounts Receivable
  • Tapping the latent capabilities of the existing IT system
  • Rationalizing private fleets and other fixed costs vs. outsourcing / variable cost alternatives

This is a powerful topic. Often, risks are not readily visible above the surface to the naked eye. We need to look for the following indicators that could show a company is susceptible to the risks listed above.

IndicatorWhat it can mean
No documented make
vs. buy analysis
Often, there is a substantial added benefit to make something you buy, or to buy something you make. In some cases, you have the scale to justify expanding your fixed cost base, and at other times your suppliers offer a cost structure that beats your own. If the company does not document make vs. buy decisions, there may very well be an opportunity.
No documented distribution network design analysisCompanies often have more facilities, or space, than they need to serve their customers. Warehouses can come with an acquisition. Customers can require a facility be maintained to support their operations. A company manager might be comfortable operating on a large investment in inventory (you can’t sell from an empty cart!!). Compound multiple such scenarios over time and you will have a foot print no one would design from scratch. A quick and dirty sketch of the current distribution network will show any duplicate locations and will provide the motivation for additional investigation.
Does the company turn inventory among the top performers in their industry?We cannot collect revenues from a customer we have not invoiced. Similarly, every day an item sits in inventory, it is not being invoiced to a customer. Since “good” inventory turn levels vary by industry, comparing the company to competitors provides a good benchmark.
The company controls the release of inbound raw materials.In the article on Variable costs we explored sourcing approaches that indicate opportunities to reduce variable costs. In addition to managing variable costs, value added sourcing agreements can provide for inventory programs, consignment inventory, smaller minimum order quantities, block scheduling, demand forecast and production schedule sharing and other terms that can reduce inventory. Not only do we may reduce the amount of inventory we have to carry, but we can shift some of the inventory to our suppliers’ financials.
The company conducts a physical inventory. Part One.Banks tend to require that physical inventories be taken when the company demonstrates that their perpetual inventory is not, or may not be accurate. If they have solid inventory controls in place and conduct cycle counts, then the bank will rely on the perpetual inventory. If the bank is not comfortable, then we look closely at how well the record inventory transactions, how well they use their system and how they physically control the materials. The short story is, if the company does not know what they have in inventory, they will inevitably hold more than they need. When this happens, the extra working capital required is the least of the company’s problems; it is the tip of the iceberg. See the section on IT below for a painful example of a major issue that results in the bank requiring a physical inventory.
The company conducts a physical inventory. Part TwoERP and MRP systems, at one level, are very simple. If you have an accurate bill of materials (BOMs), accurate routings, and an accurate perpetual inventory, a competent system will provide good triggers to help you run your business. This is a proven path. MRP systems only work if your BOMs are accurate and if your perpetual inventory is accurate. If either is wrong the system will suggest purchases and inventory moves that are WRONG. This will lead to increases in inventory and space requirements. This will lead to lower order fulfillment rates. In the words of Dr. Vinkman, this would be bad. It is a gift that keeps giving. You increase your inventory investment and you lose sales.
Joe needs a walkie talkie.We visited a warehouse and asked the front desk clerk, Joe, what he needed to do his job better. How could we help? He thought for a minute and brightened and asked for a walke talkie. How would that help? Joe explained that when a customer comes in and asks for a specific part, he looks it up on the computer and sees if it is in stock. Then he walks back into the warehouse to see if it is actually there. If he had a walkie talkie, then he could have someone else check so he wouldn’t have to leave the customer at the counter. We have found that poor inventory transaction processes lead to inaccurate inventories and to underutilized IT systems.
They have a private fleetManufacturing and distribution companies cannot compete with the cost structure of transportation companies. Dedicated freight companies have the scale to buy assets more effectively, to recruit and train drivers and to maintain the vehicles. If the company has a private fleet, dive in deep to find out why. It is often a relief valve to make up for poor processes in other areas of the company, or is a relic kept around to “serve the customer”.
They do not measure asset / equipment utilizationIf it isn’t measured, it is not done well consistently. Period.
No recent 5S red tag eventIn a “5S red tag” event, a company goes through every operation and every square foot of space within a facility and tags any item that is not currently needed to fill orders. Any such item is then collected and quarantined for a period of time. If the item is not needed, then is it dealt with appropriately? Effective red tag events often find materials, tools and equipment that people are used to seeing and have not questioned. If the company has not recently moved or held such an event, there will be a surprising amount of space that can be freed up.
Are days of sales outstanding (DSO) in accounts receivable better than industry norms? Is DSO at or below target for the company?After a sale is made and the customer is invoiced, the company has decided to rely on the customer’s ability and habit to pay as negotiated on a timely basis. If the company does not track DSO, if they are above their target levels, or if they take longer to collect than other companies in their industry, then there is an opportunity to improve.

A consumer products client manufactured and distributed their own branded products. They built a tremendous brand and a loyal customer base. They also realized that their plant sat idle for part of the year due to seasonality. We helped them complete a make vs. buy analysis comparing contract manufacturers and 3rd party distribution to their internal cost structure. The analysis and eventual results showed that the company’s EBITDA would go up 40%, and their return on capital would grow by more than 4 fold by making this move. Today they are a brand management company focused on sales and marketing. The manufacturing and distribution are left to the dedicated experts. While this example requires that a company defines who they are to evaluate the relevance of such an approach, many other make vs. buy decisions allow us to move a cost, step or process to the party best able to manage or complete the step. Look for these signs and do the math. You will help management focus on core competencies, grow the company, and earn a better return on your capital.

If you have any questions or requests, please feel free to contact me at tvm@proactiongroup.com.

Case Study: Lean Transformation Enables Smooth Product Launches and Drives EBITDA Improvement

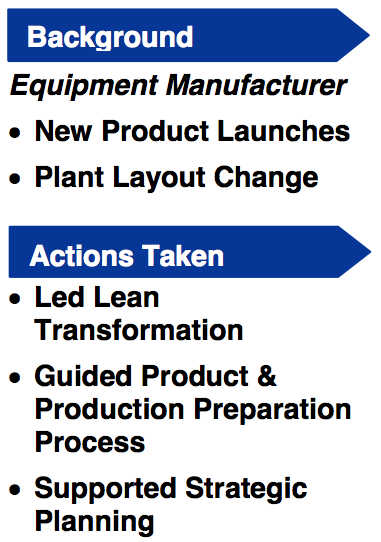
There would be no “snow days” in the forecast for a leading manufacturer of plowing and spreading equipment. The company was preparing to integrate a new acquisition and to launch two new products. To accommodate this growth, a major layout change and freeing up floor space was required at one of its facilities. Despite a lean effort for over a year, the plant’s performance was lagging behind the company’s other sites.

Lean TransformationThe ProAction Group reinvigorated the Lean transformation effort at the client’s plant with a hands-on application of Lean tools. We employed Value Stream Mapping to assess the opportunity and then began eliminating waste in the facility. The team used 5S, Visual Management, and Takt Time Management to streamline operations. Quick Changeover and Total Productive Maintenance were implemented to minimize downtime. We introduced metrics which allowed the plant to manage for daily improvement in its processes, including first-pass Standards of Work which eliminated costly re-work.

We led the Product & Production Preparation Process which ensured a timely and successful launch of the new products. The team employed a Design for Value approach with a focus on quality. We optimized the arrangement of people, machines, materials, and methods to maximize work flow and minimize waste.

ProAction also supported the client in constructing their strategic plans. We guided the roll-out of Lean practices across the entire enterprise. We conducted organizational capabilities assessments and recommended staffing changes. We also recommended sourcing activities to support the company’s expected growth.

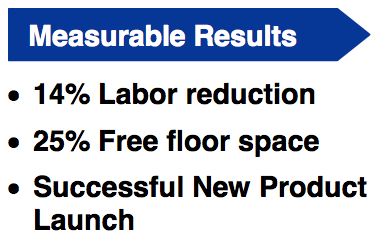
EBITDA ImprovementThe Lean transformation put the plant back on track to meet performance expectations. We reduced the labor cost by 14%. Changing the plant’s layout improved the work flow by 32% and reduced the occupied manufacturing area by 25%, freeing up space for the production of its new products.
Need help with Lean transformation at your company? Contact us today to learn how we can help.

GET STARTED TODAY

Case Study: “Hidden” Operational Improvements Drive 50% Increase in EBITDA In 6 Months…

Operational ImprovementsThe company, a leading international provider of pharmaceutical packaging solutions, focused on the long term care, retail and nutraceutical markets.
ProAction conducted the operational due diligence pre-close for its Private Equity client who was engaged in a competitive bidding process for the business.

Our tasks:

  • Uncover and quantify any EBITDA improvement opportunities beyond those identified by management and the PE client
  • Identify any hidden risks that would prevent the company from realizing their stated plans

We were successful on both counts.

  • The “Hidden” Improvements in EBITDA and Working Capital Improvements: We quantified just over $1 million in EBITDA improvements, and $1.25 million in inventory reduction.
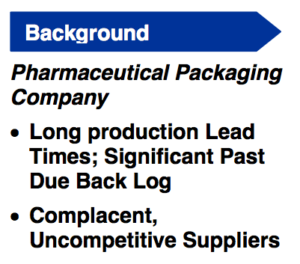
    • These improvements primarily stemmed from 2 opportunities. The first related to lean manufacturing and scheduling opportunities in the plant. Their current approach to running the plant resulted in a significant past due backlog, high overtime costs, and late deliveries. The second related to their sourcing strategy and supply base. We found that they had no clear sourcing strategy and were laden with long term and untested suppliers.
  • The Risk: The company’s IT system was stable, but not scalable. It was built on a set of 5 connected legacy systems and would likely need to be upgraded or replaced prior to a sale to a financial buyer.
    • Given company plans for organic growth, the system would be fine for 3-5 years. We estimated the cost to implement a new system and the sponsor incorporated this into their financial model.

Our client used our information to update their model and our presentation to educate the lenders on the assumptions and evidence of the opportunities. With these enhancements incorporated into their offer, our client won the auction and acquired the company.

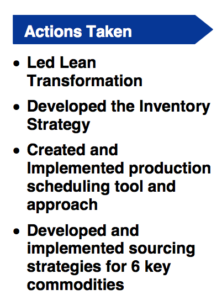
Operational Due DiligencePost close, the company retained ProAction to work with management to implement the improvements identified during diligence. We led the company through the value stream mapping process and, together, created the road map. Key parts of the implementation phase included:
  • Developing and implementing actionable sourcing strategies for six (6) different commodities.
  • Creating a lean scheduling methodology/process for strategic stocking levels and delivery improvement.
  • Running kaizen and other improvement events, teaching the plant personnel to conduct root cause analysis and take corrective action (we taught the organization how to improve habitually on their own)
  • Providing training on Lean Methods Tools to management and operators.

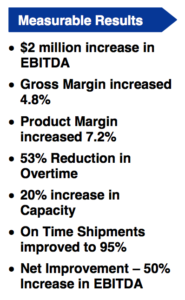
EBITDA Improvement OpportunitiesAs a result of these actions, annual EBITDA increased by $2 million, or 50%, in six months. The better news, however, is that this financial improvement was accompanied by increased service levels, reduced stress in the plant and a 20% increase in effective capacity. During this period, the top line remained steady.

Within 18 months of acquiring the company, our Private Equity client refinanced and took their money off the table. Within 36 months they monetized the investment and netted a strong return, all without a meaningful increase in the top line of the company.

Simple EBITDA Enhancements – Bannockburn Global Forex, LLC

“A proactive approach to foreign currency transactions and exposures is among the least understood yet quickest ways to enhance EBITDA for PE funds or their middle market portfolio companies.”

Bannockburn Global Forex, LLC is an important alliance partner of The ProAction Group. Their team has helped us identify opportunities to increase EBITDA in our PRE-close diligence and they have helped our clients dramatically reduce their costs to operate internationally. Keep reading to learn more about their process of implementing simple EBITDA enhancements.

YOUR SOLUTION

Bannockburn Global Forex, LLC is a boutique currency trading and advisory firm, dedicated to the needs of financial sponsors and their middle market operating companies. Bannockburn’s currency experts become an extension of your team to assure the most efficient execution of cross border transactions at the fund and portfolio level.

TALK TO US IF YOUR FUND OR PORTFOLIO COMPANIES

  • Engage in cross border M&A
  • Import, export, or have global operations
  • Consider foreign currency denominated capital expenditures
  • Are exposed to earnings volatility driven by currency fluctuations

WHAT YOU WILL RECEIVE

  • A forensic analysis of your past transaction activity to quantify cost savings potential
  • An easily implemented solution that delvers efficient and transparent pricing going forward
  • Expert detailed guidance on risk exposure and risk management strategies

 GET STARTED TODAY

Due Diligence: Indicators of Opportunity

Indicators of Opportunity: The following indicators show the items we look for in our initial due diligence site visits. They represent the smoke that lets you know there is a fire. If any of the following are true, your company has the ability to make meaningful improvements in variable costs and EBITDA. Period.

Indicators of Opportunity

Indicator

What it can mean

The company does not maintain a closed-loop metric system. The company does not post visible metrics. If you can’t measure something, it doesn’t exist. This may seem to be a strong statement, but it is hard to overestimate the impact of measuring performance, conducting root-cause analysis, and implementing corrective action. Companies that do this show continuous improvements. Companies that don’t will go backwards. No one stays stagnant – you either get better or you get worse. We often see a 10- to 15-percent improvement in performance when we start effectively measuring it.
No defined sourcing strategy. For many manufacturing and distribution companies, the cost of purchased goods and services is 60 to 80 percent of the cost of goods sold. Yet, much of this spend is set up and managed by relatively low-level clerks and untrained buyers. If a company does not have documented sourcing strategies, it is an indicator that there is significant opportunity to better utilize their leverage with suppliers.
Sourced materials have not been competitively bid in the last three to five years. Perhaps counter intuitively, we have found evergreen (ongoing) contracts to indicate that the company does not test the market and leverage their volume and position to their full advantage. Some companies do put specific and narrow needs out to bid. Either of these signals potential to improve the cost of goods purchased and related items.
The company does not measure supplier performance. In a tightly run plant, suppliers have to deliver exactly what is needed when it is needed. No room for inspections, late deliveries, inaccurate picks, or defects. Companies that do not maintain a closed-loop system on supplier performance cannot maintain a high level of performance.
Sourcing agreements are not documented or are limited to pricing terms (excluding issues such as order management, inventory management, hedging, allocation, future pricing, etc.) Regardless of who you are and how big your company is, your suppliers’ resources dwarf your own. Effectively negotiating with your suppliers sets up your ability to leverage their resources to your benefit. If the company limits their negotiation to pricing terms, they are missing out on significant value. If the agreements are not documented, it is another sign that sourcing needs further investigation.
Inbound freight costs are buried in product costs. A common answer to “Who pays freight on incoming shipments” is, “Oh, well, freight is free.” We often find that suppliers build profit into freight charges. Unbundling freight costs can lead to significant improvements.
Schedule attainment is not measured. One of the first questions we ask a plant manager during a tour is, “How are things going?” If they respond, “Great, all the machines are running” or “Our efficiencies are well over 100 percent”, then we know they are likely scheduling the plant based on a “push” methodology. There is a good likelihood that they are building schedules to minimize changeovers and downtime. Measuring schedule attainment is most common among higher-performing companies that run the plant to fill customer orders or on some type of pull system.
Invoice accuracy/denials/ chargebacks are not measured or tracked. Credit memos, chargebacks, denied claims, and inaccurate invoices all show potential buckets of improvement. If the company does not actively track and measure these items, it is unlikely that they are well managed.
E&O reserve is insufficient to cover actual levels. Excess and Obsolete inventory is a target-rich area. Any of the following situations can indicate that the company can reduce the amount of E&O inventory it creates through ongoing operations: -The company does not measure or track E&O. - The company does not perform root-cause analysis and corrective action processes on E&O. -An aging of the inventory shows balances in excess of one year that exceed reserves.
Forecast is not measured or is low quality. Often, companies that do not have the discipline to forecast well put unnecessary burdens on operations. These burdens lead to E&O inventory, overtime, downtime, expediting costs, and chaos. If forecast accuracy is low or not measured, the company is likely not managing this area effectively.
Service levels are low. There are rare instances that require a company to provide poor service and quality levels to their customers. If a company does not have an industry-leading perfect order level, has longer lead times than competitors, or has high scrap/warranty costs, then there is likely a significant opportunity to improve operations and EBITDA.
Service levels are buoyed by high inventory levels. One easy method to lift service levels is to increase inventory. This approach, however, leads to many costs and problems. If a company has competitive service levels, but holds more inventory than others in their industry, there is opportunity.
Significant work in process (WIP) and overproduction. Work in process may not be evil, but it is close. When we tour any factory or office, we look for WIP in front of machines, in warehouses or in inboxes in the office. Any of these can indicate unbalanced lines and processes. Putting lines and processes into balance leads to cost, service level, inventory, and lead-time improvements.
The company has not conducted a value engineering exercise. We know that lean manufacturing and process re-engineering can work to dramatically improve cycle times and lead times, and lower the costs to process paperwork, products, and services. The same mindset can be applied to the product design itself. Design for manufacturing, value engineering, or similar methodologies can dramatically improve the landed cost for an item.
Variation If anything is worse than WIP, variation might be the thing. If a company does not measure variation in scrap, quality, cycle times, warranty costs, or key specification measures, the opportunity could be significant. When variation is reduced, costs go down.
Plant observations of the “7 Wastes” - defects, overproduction, inventory, transportation, waiting, motion, extra processing These items represent the most fundamental items to observe during the plant tour and to have management communicate their views on the measurement and management of these wastes. Individually, these items can be identified and quantified for focused improvement efforts. Collectively, they represent the cornerstone of any operational excellence initiative to enhance profits, service, and morale.